Heatmaps
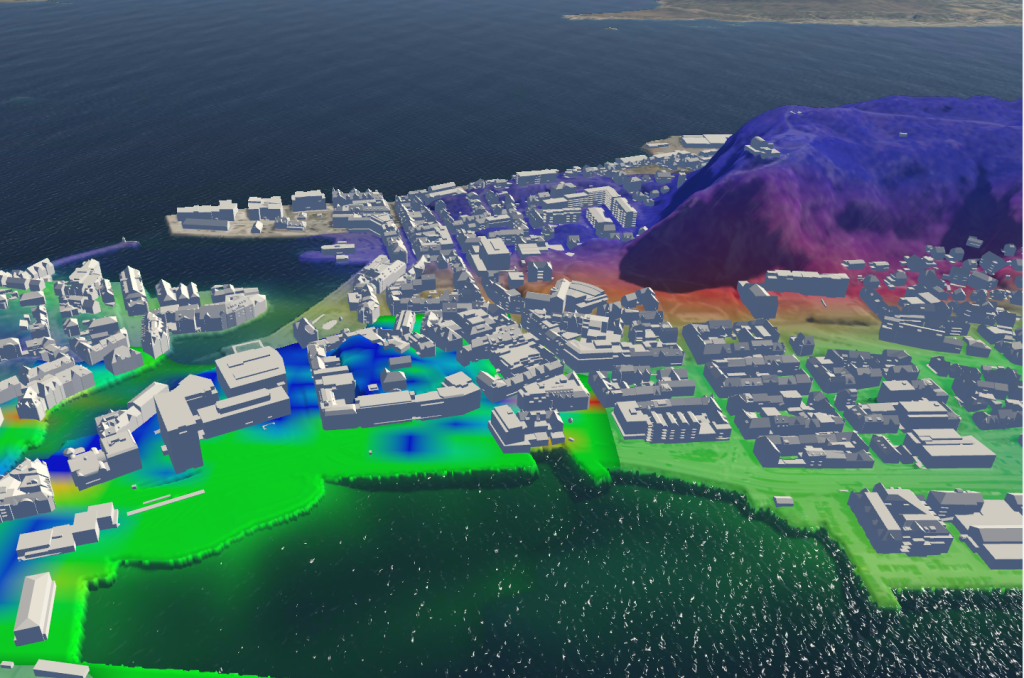
A Heatmap in Aalesund showing the density of amenities in the area.
Purpose
Heatmaps are used to show graphical representation of numerical data in a matrix layout where individual values are cells in the matrix and are represented as colors.
File structure and rules
Heatmap data must be written in a CSV file with the following columns:
Header |
Description |
|---|---|
time |
Distinct points in time. Format: mm-dd-yyyy hh:mm:ss |
lat |
Latitude (-90 to 90, up to 6 decimals) |
lon |
Longitude (-180 to 180, up to 6 decimals) |
<DataHeader> |
Heatmap data (header can be named as needed) |
Rules:
The .csv file must follow the format above.
No special characters (e.g. Æ, Ø, Å)
All fields separated by comma (,)
No additional end-of-lines at the end of the document or between the header and data.
Example of a Heatmap CSV file in Excel format
Headers (time,lat,lon) must be lowercase. Format all columns as text. Pay attention to time formatting.
time |
lat |
lon |
amenity |
|---|---|---|---|
18-05-2024 00:00:00 |
62.473905 |
6.150525 |
0 |
18-05-2024 00:00:00 |
62.47349 |
6.150525 |
5.0 |
18-05-2024 00:00:00 |
62.473074 |
6.150525 |
1.0 |
18-05-2024 00:00:00 |
62.472659 |
6.150525 |
0 |
18-05-2024 00:00:00 |
62.472244 |
6.150525 |
0 |
18-05-2024 00:00:00 |
62.471829 |
6.150525 |
2.0 |
18-05-2024 00:00:00 |
62.471414 |
6.150525 |
3.0 |
18-05-2024 00:00:00 |
62.470998 |
6.150525 |
2.0 |
18-05-2024 00:00:00 |
62.470583 |
6.150525 |
2.0 |
Example of a Heatmap CSV file in text format
 1time,lat,lon,amenity
 218-05-2024 00:00:00,62.473905,6.150525,0
 318-05-2024 00:00:00,62.47349,6.150525,5.0
 418-05-2024 00:00:00,62.473074,6.150525,1.0
 518-05-2024 00:00:00,62.472659,6.150525,0
 618-05-2024 00:00:00,62.472244,6.150525,0
 718-05-2024 00:00:00,62.471829,6.150525,2.0
 818-05-2024 00:00:00,62.471414,6.150525,3.0
 918-05-2024 00:00:00,62.470998,6.150525,2.0
1018-05-2024 00:00:00,62.470583,6.150525,2.0
Visualizing the Heatmap in Sandbox
Uploading the CSV file
Upload the Heatmap CSV file by using the Datasets Library. Select Positional as dataset type from the category drop-down menu.
Loading the Heatmap
After uploading, load the Heatmap as described in the Local Data section. Press the Reload Data button.
Heatmap visibility
Heatmaps are visible by default after loading from Local Data. Toggle visibility as described in the Data View section. Heatmaps are not affected by the Timeline.