Bargraphs
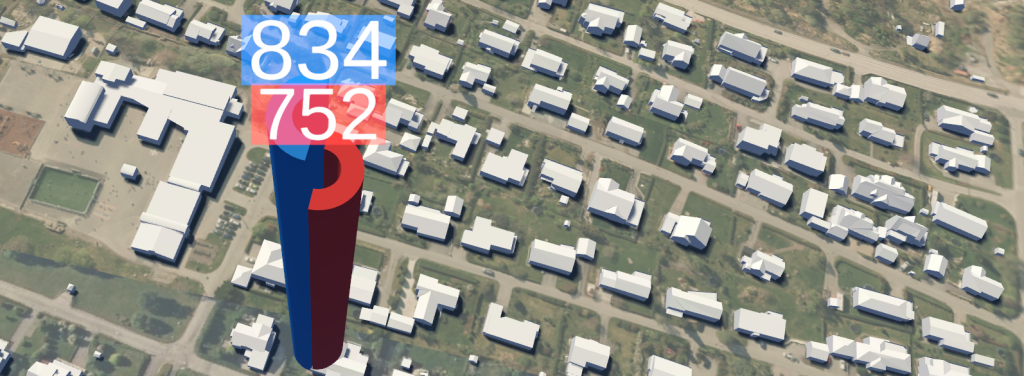
Bargraphs are a great way of displaying data over time and offer great flexibility. The graph shows the sample dataset provided below. Radius is set to 10m for both segments and scaling is set to a value of 0.25.
Purpose
Bargraphs are used to show the changes in a metric over time as a series of bars. You can also graph multiple series to show the breakdown of a metric across dimensions, and how the values vary over time.
File structure and rules
Bargraph data must be written in a CSV (Comma Separated Values) file with the following columns:
Header |
Description |
|---|---|
Time |
Distinct points in time. Format: yyyy-mm-dd hh:mm:ss |
Lat |
Latitudinal angle in degrees |
Lon |
Longitudinal angle in degrees |
<DataHeader> |
Bargraph data (can be named descriptively) |
Additional <DataHeader> |
Additional columns for more bargraph segments |
Rules:
The .csv file must follow the format above.
No special characters (e.g. Æ, Ø, Å)
Time must follow this format: yyyy-mm-dd hh:mm:ss
All fields separated by comma (,)
No additional end-of-lines at the end of the document or between the header and data.
Example of a Bargraph CSV file in Excel format
Time |
Lat |
Lon |
0-19 |
20-39 |
|---|---|---|---|---|
2022-01-01 00:00:00 |
62.4642 |
6.32812 |
834 |
752 |
2023-01-01 00:00:00 |
62.4642 |
6.32812 |
814 |
742 |
2024-01-01 00:00:00 |
62.4642 |
6.32812 |
838 |
803 |
2025-01-01 00:00:00 |
62.4642 |
6.32812 |
819 |
789 |
2026-01-01 00:00:00 |
62.4642 |
6.32812 |
806 |
767 |
2027-01-01 00:00:00 |
62.4642 |
6.32812 |
797 |
750 |
2028-01-01 00:00:00 |
62.4642 |
6.32812 |
793 |
743 |
2029-01-01 00:00:00 |
62.4642 |
6.32812 |
783 |
738 |
2030-01-01 00:00:00 |
62.4642 |
6.32812 |
767 |
711 |
Warning
Using Excel or other CSV editors to edit your data may cause your data to lose the correct format. Pay particular attention to the way time is formatted. You may have to use a custom format to achieve the desired format of yyyy-mm-dd hh:mm:ss.
Example of a Bargraph CSV file in plain text format
 1Time,Lat,Lon,0-19,20-39
 22022-01-01 00:00:00,62.4642,6.32812,834,752
 32023-01-01 00:00:00,62.4642,6.32812,814,742
 42024-01-01 00:00:00,62.4642,6.32812,838,803
 52025-01-01 00:00:00,62.4642,6.32812,819,789
 62026-01-01 00:00:00,62.4642,6.32812,806,767
 72027-01-01 00:00:00,62.4642,6.32812,797,750
 82028-01-01 00:00:00,62.4642,6.32812,793,743
 92029-01-01 00:00:00,62.4642,6.32812,783,738
102030-01-01 00:00:00,62.4642,6.32812,767,711
Visualizing the Bargraph in Sandbox
Uploading the CSV file
Upload the Bargraph file by using the Datasets Library. Select Positional as dataset type from the category drop-down menu.
Loading the Bargraph
After uploading, load the Bargraph as described in the Local Data section. Press the Reload Data button.
Bargraph visibility
Bargraphs are visible by default after loading from Local Data. Toggle visibility as described in the Data View section.
View the Bargraph timeline
Bargraphs display data over time. Make sure you are displaying the correct period of time on the Timeline Timeline.
Editing the Bargraph
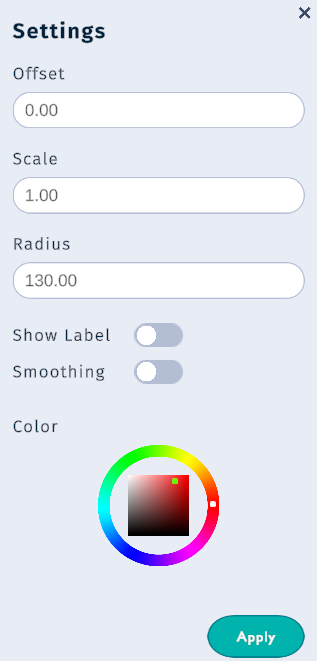
Figure 1: Bargraph Settings
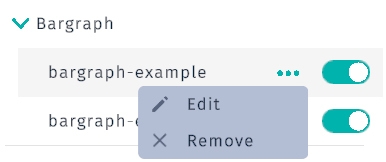
To edit Bargraph attributes, locate it in the Data View and press the … to the left of the visibility toggle button. Then select Edit.
You are then presented with the options shown in Figure 1. These options are available for each of the segments in a Bargraph. For the example file above you would have a Bargraph with 2 segments (0-19 and 20-39).
Offset: Set elevation for the Bargraph locationScale: Adjust height scalingRadius: Set radius in metersShow Label: Toggle to display current value above the BargraphSmoothing: Enable for smooth changes between data pointsColor: Select color for each segment
Acquiring data
You can edit a map using Google Maps’ My Maps feature and export points as CSV or KML files. Example formats:
CSV Export
1WKT,name,description
2"POINT (6.32812 62.4642)",Åsemarka,Location of the Bargraph in the example file.
KML Export
 1<?xml version="1.0" encoding="UTF-8"?>
 2<kml xmlns="http://www.opengis.net/kml/2.2">
 3  <Document>
 4    <name>Bargraph Example</name>
 5    <Style id="icon-1899-01579B-labelson">
 6      <IconStyle>
 7        <color>ff9b5701</color>
 8        <scale>1</scale>
 9        <Icon>
10          <href>https://www.gstatic.com/mapspro/images/stock/503-wht-blank_maps.png</href>
11        </Icon>
12        <hotSpot x="32" xunits="pixels" y="64" yunits="insetPixels"/>
13      </IconStyle>
14    </Style>
15    <Placemark>
16      <name>Åsemarka</name>
17      <description>Location of the Bargraph in the example file.</description>
18      <styleUrl>#icon-1899-01579B-labelson</styleUrl>
19      <Point>
20        <coordinates>
21          6.32812,62.4642,0
22        </coordinates>
23      </Point>
24    </Placemark>
25  </Document>
26</kml>
Refer to Google’s documentation for KML format details.
Alternatively, use Google’s discover coordinates features.