Timeline
The timeline can be used to view your dataset as time passes. You have full control over speed and duration of the simulation using the timeline tools.

The timeline displayed above is important for visualizing datasets in time. All the features of the timeline are detailed in the sections below.
Accessing the Timeline


Timeline Controls and Features
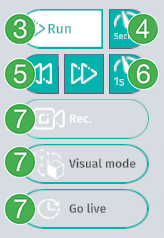
“Run” button: Makes time move.
Drop-down menu: Change how fast time moves (seconds, minutes, hours, days, months, years, decades).
Decide whether time should move forwards or backwards.
Set the interval for the selected time unit (e.g., 1-60 seconds per second).
Options currently unavailable.
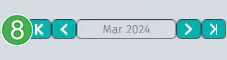
Shows your position on the timeline. Inner arrows move forwards/backwards; outer arrows jump to places with datasets.
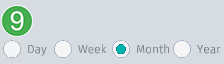
Set the time frame the timeline should show. Change with CTRL + mouse scroll.

Loop within a dataset when running. Creates a loop for the duration of the dataset.
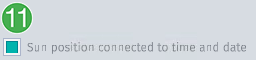
Sun position check mark: Makes the sun adhere to the time and date in the timeline. Useful for realistic shadow and light. Combine with Weather & Environment settings.
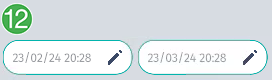
Set the start and end date of the timeline.

Search for datasets by name.
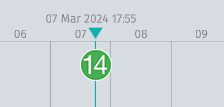
Pointer: Represents your current position on the timeline. Click the green triangle to drag or click a date to move instantly. Date and time are displayed above the triangle.